How to Use the Inventory Turnover Equation to Optimize Your Stock Levels in 2026
Lets talk about Inventory Turnover Equation. In the world of business, sitting still is often the same as moving backward. This is especially true for physical products. Whether you are running a boutique clothing shop, a massive e-commerce warehouse, or a local grocery store, your success depends on one thing: movement. If your products are sitting on shelves collecting dust, your cash is sitting there with them.
But how do you measure that movement? How do you know if you are selling fast enough to stay profitable or if you are overstocking items that nobody wants? The answer lies in a powerful metric known as the inventory turnover equation.
In this guide, we will break down everything you need to know about this formula, why it matters, and how you can use it to fine-tune your business operations for maximum growth.
What Exactly Is Inventory Turnover?
At its simplest, inventory turnover is a measure of how many times a company has sold and replaced its inventory during a specific period—usually a year. Think of it as the “heartbeat” of your supply chain.
A “turn” happens when you sell the stock you purchased and replace it with new goods. If you sell out and restock four times a year, your turnover ratio is 4. If you do it ten times, it’s 10.
Understanding this number is vital because it reveals the efficiency of your management. It tells you if your sales team is hitting their marks, if your buyers are choosing the right products, and if your warehouse is being used effectively.
The Inventory Turnover Equation: Breaking Down the Formula
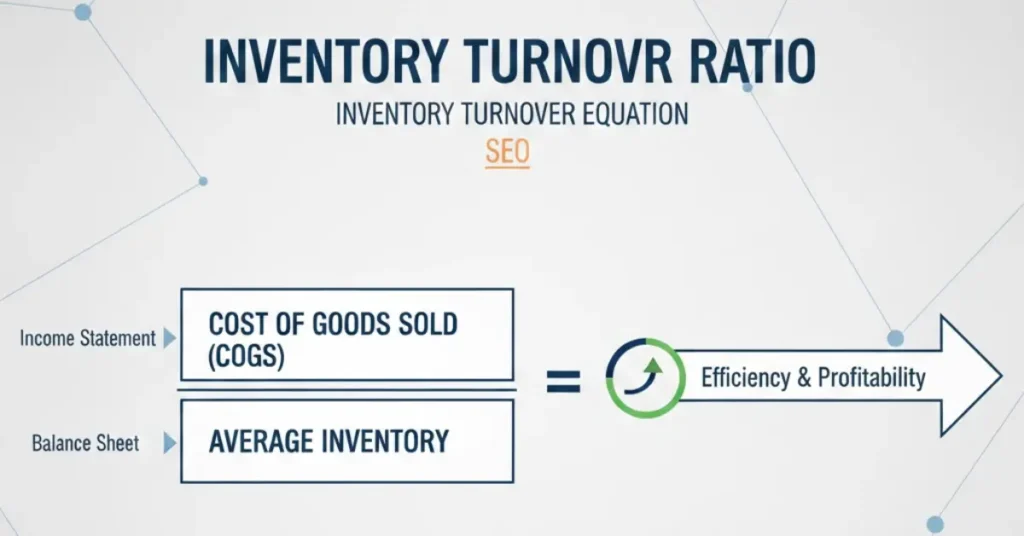
To find your turnover ratio, you don’t need a degree in advanced mathematics. You just need two key figures from your financial statements: the Cost of Goods Sold (COGS) and your Average Inventory.
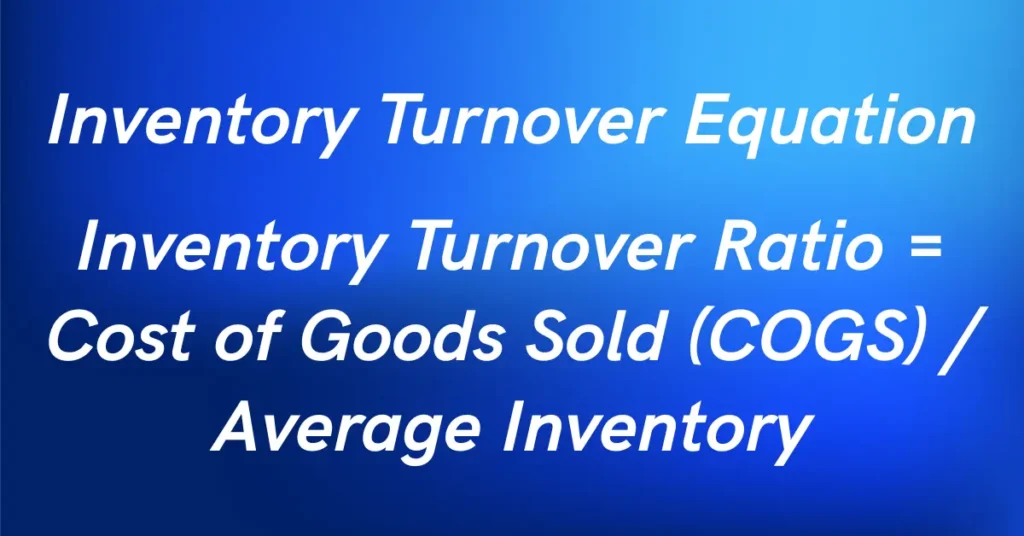
The Formula:
Inventory Turnover Ratio = Cost of Goods Sold (COGS) / Average Inventory
Let’s look at the components:
- Cost of Goods Sold (COGS): This is found on your income statement. It represents the direct costs of producing or purchasing the goods you sold during the period. It’s important to use COGS rather than “Total Sales” because sales figures include a markup (profit), while inventory is recorded at cost. Using sales would give you an inflated, inaccurate ratio.
- Average Inventory: Since inventory levels fluctuate throughout the year (think of a toy store at Christmas versus in July), using a single snapshot isn’t always accurate. To find the average, take your Beginning Inventory (what you had on day one) plus your Ending Inventory (what you had on the last day), and divide by two.
Putting It into Practice
Imagine a retail company called “Peak Gear.” Last year, their COGS was $500,000. They started the year with $90,000 worth of stock and ended with $110,000.
- Average Inventory: ($90,000 + $110,000) / 2 = $100,000
- Turnover Ratio: $500,000 / $100,000 = 5
This means Peak Gear cleared out and replenished its entire warehouse five times over the year.
Interpreting the Numbers: What Is “Good”?

A common question business owners ask is: “Is my number good?” The truth is, there is no universal “perfect” number. The ideal ratio depends entirely on your industry.
- High-Volume/Low-Margin (Groceries/Fast Fashion): These businesses need high turnover ratios, often between 10 and 20. Milk and bread have to move fast, or they spoil. Fashion trends change in weeks.
- Low-Volume/High-Margin (Luxury Cars/High-End Jewelry): A luxury watchmaker might only have a turnover of 1 or 2. Since their profit per item is massive, they can afford to have items sit in a display case for months.
High Turnover: The Pros and Cons
Generally, a high ratio is a great sign. It means:
- Strong Sales: Customers want what you’re selling.
- Lower Costs: You aren’t paying for massive warehouse space or insurance on stagnant items.
- Fresh Stock: You are constantly bringing in new, relevant products.
The Risk: If your turnover is too high, you might be “understocking.” If you sell out too fast and can’t restock in time, you’re leaving money on the table because customers will go elsewhere when they see an “Out of Stock” sign.
Low Turnover: The Red Flags
A low ratio usually suggests:
- Weak Demand: You might be stocked up on items that are no longer popular.
- Overstocking: You bought too much, and now your cash is “locked” in the warehouse.
- Obsolescence: For tech or perishable goods, low turnover is a death sentence. Dead stock (items that will never sell) eats up your profits.
Beyond the Ratio: Inventory Turnover Days
Once you have your turnover ratio, you can take it a step further to calculate the Days Sales of Inventory (DSI). This tells you exactly how many days, on average, it takes to turn your stock into cash.
The Formula:
DSI = 365 / Inventory Turnover Ratio
Using our earlier example with Peak Gear (Ratio of 5):
- 365 / 5 = 73 Days
This means every item Peak Gear buys stays in the building for about 73 days before a customer takes it home. This is a fantastic metric for visualizing your “cash cycle.”
Why the Inventory Turnover Equation Matters for Your Bottom Line
Why should a busy manager or entrepreneur care about this math? Because it impacts almost every part of a business.
1. Liquidity and Cash Flow
Cash is the lifeblood of any business. When you buy inventory, your cash is “frozen.” You can’t use it to pay rent, hire staff, or invest in marketing until that inventory is sold. A healthy turnover ensures that cash is constantly flowing back into your bank account.
2. Reduced Holding Costs
Inventory isn’t free to keep. You have to pay for the warehouse space, electricity to keep the lights on, security, insurance, and the labor to count it. The faster you move items, the less you spend on these “carrying costs.”
3. Smarter Purchasing Decisions
The turnover equation isn’t just for the whole company; it can be applied to specific categories or even individual SKUs (Stock Keeping Units). If you see that “Product A” turns 12 times a year while “Product B” turns twice, you know exactly where to spend your next purchasing budget.
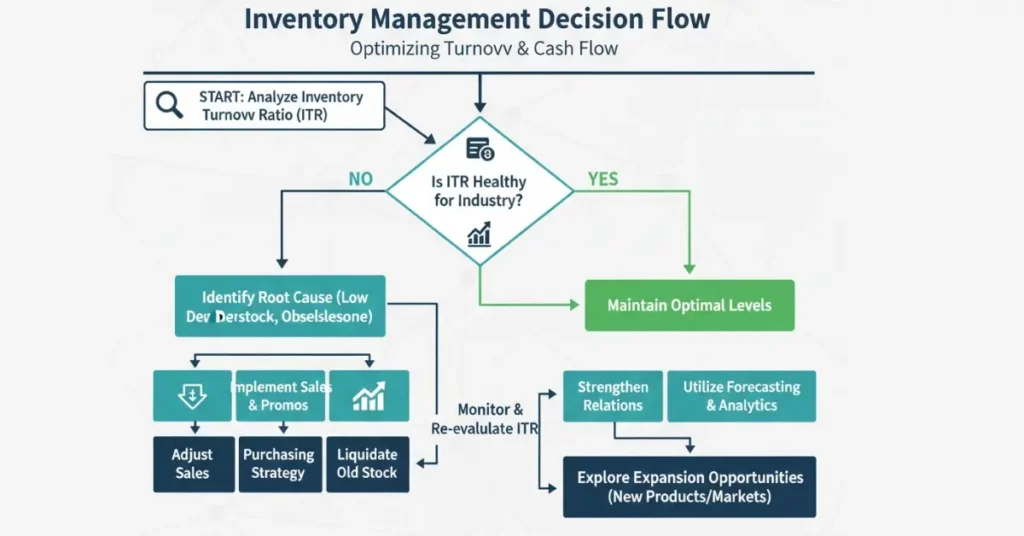
5 Pro Tips to Optimize Your Inventory Turnover
If your ratio isn’t where you want it to be, don’t panic. The following five ways will improve your inventory turnover:-
- Improve Your Forecasting: Use historical data to predict when demand will spike. Don’t just guess; look at what happened last year and adjust for current market trends.
- Liquidate Slow-Movers: If you have “dead stock” taking up space, run a flash sale or bundle it with popular items. It’s better to sell it at cost (or even a slight loss) to free up space for something that actually sells.
- Review Your Pricing: Sometimes a low turnover is simply because the price is too high. A small discount might be all it takes to trigger a surge in sales.
- Strengthen Supplier Relationships: If you can get smaller, more frequent deliveries from your suppliers, you can maintain a “leaner” inventory, which naturally boosts your turnover ratio.
- Invest in Automation: Modern inventory management software (like NetSuite or specialized ERPs) can track your turnover in real-time. Instead of doing the math once a year, you can see your “heartbeat” every single day.
The Limitations: A Word of Caution
While the inventory turnover equation is a goldmine of information, it isn’t perfect.
- Seasonality: A yearly average can hide the fact that you were struggling in June but booming in December.
- Bulk Discounts: Sometimes it makes sense to have a lower turnover if you bought a massive amount of stock at a 50% discount. The savings on the purchase price might outweigh the cost of holding it.
- Supply Chain Disruptions: In a world of shipping delays, some companies intentionally “overstock” to ensure they don’t run out. This lowers their ratio but protects their customer experience.
Industry Benchmarks for Inventory Turnover
| Industry Sector | Typical Turnover Ratio | Average Days to Sell (DSI) | Why it differs? |
| Grocery & FMCG | 12.0 – 20.0 | 18 – 30 Days | High perishability and constant demand require fast stock rotation to prevent spoilage. |
| Consumer Electronics | 7.0 – 10.0 | 36 – 52 Days | Rapid technological obsolescence forces brands to move stock before the “next big thing” arrives. |
| Retail (Apparel) | 4.0 – 7.0 | 52 – 91 Days | Highly seasonal; items must clear out within a few months to make room for the next season’s line. |
| Automotive | 2.0 – 5.0 | 73 – 182 Days | High-ticket items with long lead times. A dealership doesn’t need to sell a car every day to stay profitable. |
| Heavy Machinery | 1.0 – 3.0 | 121 – 365 Days | Complex manufacturing and niche buyers mean parts and machines sit in inventory for long periods. |
Key Takeaways for Your Strategy
- The Margin Rule: Generally, the higher your profit margin per item, the lower your turnover can afford to be. Luxury jewelers thrive on a turnover of 2.0 because one sale covers significant costs.
- The Perishability Rule: If your product expires (food, medicine) or becomes obsolete (fashion, tech), a low turnover ratio is an emergency signal.
- The “Goldilocks” Zone: For most general retailers, the sweet spot is between 5 and 10. This ensures you aren’t paying too much for storage while keeping enough stock to avoid losing customers to “out-of-stock” notices.
The Bottom Line
The inventory turnover equation is more than just a line on a financial report; it’s a window into the health of your business. It tells the story of how well you understand your customers and how efficiently you manage your resources.
By mastering this formula, you move away from “gut feelings” and toward data-driven decisions. You’ll know exactly when to push sales, when to hold back on buying, and how to keep your cash flowing.
Remember: In business, movement is life. Use the inventory turnover ratio to keep your company moving forward.
FAQs
1. Why should I use COGS instead of Sales in the inventory turnover equation?
Sales figures include a “markup” (your profit), while inventory is recorded at “cost.” Using sales would make it look like you are moving more physical volume than you actually are, giving you an inflated and inaccurate result. Using Cost of Goods Sold (COGS) ensures an “apples-to-apples” comparison.
2. What is considered a “good” inventory turnover ratio?
There is no single “perfect” number. A good ratio depends on your industry. A grocery store might aim for 12 to 20 (selling out every 2–4 weeks), while a high-end machinery manufacturer might be perfectly healthy with a ratio of 2 or 3. Always compare your results against industry benchmarks.
3. Can an inventory turnover ratio be too high?
Yes. While high turnover usually means strong sales, an extremely high ratio can signal understocking. If you don’t have enough “safety stock,” you risk frequent stockouts, leading to frustrated customers and lost revenue because you couldn’t meet demand.
4. How often should I calculate my inventory turnover?
Most businesses calculate it annually or quarterly for formal reporting. However, for active management, it’s best to monitor it monthly. This allows you to spot trends early, such as a product line that is suddenly slowing down, before it becomes a major cash flow problem.
5. How does inventory turnover affect my taxes?
Inventory is an asset, not an expense. You can’t “deduct” the money you spent on unsold stock sitting in your warehouse. By increasing your turnover and reducing excess stock, you convert that asset into COGS (an expense), which can impact your taxable income and improve your overall tax efficiency.
Related Posts

3D Warehouse in Supply Chain Management
Discover how 3D warehouse modeling and digital twins are helping businesses maximize vertical space, boost safety with VR training, and […]
Read More →
SEO For US Logistics : How SEO is Changing the Way US Logistics Companies Get Leads in 2026
Lets explore the evolution of SEO For US Logistics in 2026. Discover how AI-driven search, Answer Engine Optimization (AEO), and […]
Read More →
Warehousing and Logistics :The Engine of Commerce
What is Warehousing and Logistics? The modern global economy is characterized by a rapid, continuous flow of goods from manufacturer […]
Read More →